|
As x moves without bound to the left or to the right, the graph of
the polynomial function eventually
rises or falls in the following manner:
1. When n is odd: a. If the leading coefficient is positive, the graph falls to the left and rises to the right. b. If the leading coefficient is negative, the graph rises to the left and falls to the right. 2. When n is even: a. If the leading coefficient is positive, the graph rises to the left and right. b. If the leading coefficient is negative, the graph falls to the left and right. For example : in the graph below we know that is an odd function and it's leading coefficient is positive. This means that it starts down on the left and finishes up on the right. It also has two turning points and has a degree of 3. It would look something like 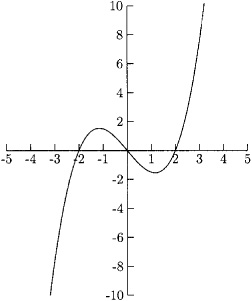
Below is an odd function and it's leading coefficient is negative. That means it starts up on the left and finishes down on the right (like a linear equation, which is odd with a negative slope). It also has two turning points (one less than the degree of the equation). It would look something like 
In the graph below we know that the function is even with a positive lead coefficient. It has 3 turning points and the degree of the equation is four. 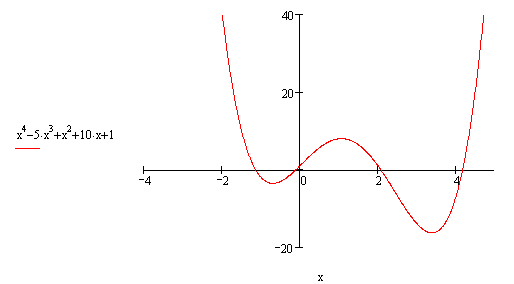
In the graph below we know that the function is even with a negative lead coefficient. It has 3 turning points and the degree of the equation is four. 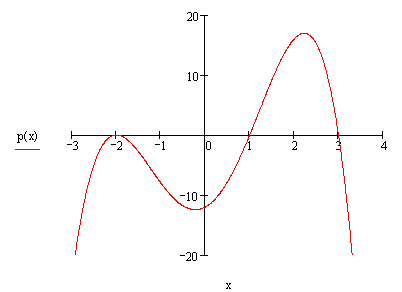
|